Tables like Object/Source are planned to be vertically partitioned into multiple tables during production. To understand how well MySQL can handle these vertical-partition joins, a study of splitting a wide table into multiple ones in different configurations can be done to measure performance.
Test Setup Information
The testing involves creating a wide table of 200 columns and timing the execution of a full scan, then slicing that table vertically into different number of columns and using JOIN to assemble the pieces together. The complete configuration of the test setup is as follows:
- Virtual machine of type
m1.smallat OpenStack/NCSA
- 2GB memory
- 1 VCPU @ 2.5GHz
Ubuntu 15.04
- Standard
MariaDBinstallation (mysql Ver 15.1 Distrib 10.0.23-MariaDB) - 4 Database configurations:
mysqltest200: 1 table, 200 columns (+1 primary index column) -> No joinsmysqltest10_20: 10 tables, 20 columns each (+10 primary index columns) -> 10 joinsmysqltest20_10: 20 tables, 10 columns each (+20 primary index columns) -> 20 joinsmysqltest50_4: 50 tables, 4 columns each (+50 primary index columns) -> 50 joins
- All configurations tested on both
MyISAMandInnoDBengines - Full scan query of the form
SELECT * - 100,000 rows of random data with Primary Index of type
BIGINTand all Secondary Columns of typeINT - Data inserted across all tables with the same order, but not sorted
key_buffer_sizechanged to 1024MB- Data fetched from memory and not from disk
Timed Query Results for MyISAM Engine
The test query is timed in two configurations. For the wide table, all columns are selected and tested across all columns in the partitioned tables. In addition, to “isolate” JOIN performance a test is also done by selecting “X” columns from the wide table, where “X” corresponds to the relevant number of tables/joins, i.e., only one column each is selected from the partitioned tables in order to correlate with the same number of columns in the wide table.
mysqltest200 |
mysqltest10_20 |
mysqltest20_10 |
mysqltest50_4 |
|---|---|---|---|
| ONETABLE.* = 3.746s | 10TABLEJOINS.* = 6.527s | 20TABLEJOINS.* = 9.951s | 50TABLEJOINS.* = 39.403s |
| ONETABLE.10COLUMNS = 0.231s | 10TABLEJOINS.1COLUMNEACH = 2.272s | N/A | N/A |
| ONETABLE.20COLUMNS = 0.426s | N/A | 20TABLEJOINS.1COLUMNEACH = 6.269s | N/A |
| ONETABLE.50COLUMNS = 0.981s | N/A | N/A | 50TABLEJOINS.1COLUMNEACH = 34.115s |
Note: Scroll table right to see all columns.
Timed Query Results for InnoDB Engine
Test query scheme for this engine is exactly the same as in the previous section.
mysqltest200 |
mysqltest10_20 |
mysqltest20_10 |
mysqltest50_4 |
|---|---|---|---|
| ONETABLE.* = 8.786s | 10TABLEJOINS.* = 9.626s | 20TABLEJOINS.* = 13.869s | 50TABLEJOINS.* = 44.252s |
| ONETABLE.10COLUMNS = 4.722s | 10TABLEJOINS.1COLUMNEACH = 5.340s | N/A | N/A |
| ONETABLE.20COLUMNS = 5.722s | N/A | 20TABLEJOINS.1COLUMNEACH = 6.979s | N/A |
| ONETABLE.50COLUMNS = 6.986s | N/A | N/A | 50TABLEJOINS.1COLUMNEACH = 20.585s |
Note: Scroll table right to see all columns.
Performance Results
The MyISAM engine performs better between the two options when doing a simple SELECT from the tables. However, with an increasing number of joins between the 10/20/50 partition scheme tested the amount of time taken increases considerably. This indicates that the fraction of time taken to do JOINs is very large in the overall computation of the query, which can be attributed to the Nested Loop Algorithm utilized by the engine. The InnoDB engine trails in performance for the simple SELECT query, but tends to do better with JOIN. In particular, the 20-table JOIN and 1-column SELECT between the two engines seem to perform very similarly, beyond which InnoDB seems to perform better. While MyISAM can do a SELECT * for the 50-table join in ~40s but in ~35s for the 50-table 1-column test, the same is performed under InnoDB in ~44s and ~21s respectively.
Query Optimization Tests
Potential improvements in query run times through optimization may be possible for these vertical partition joins. MySQL evaluates a number of possible plans depending on the type of query/joins. The amount of time spent by the query optimizer is directly proportional to the number of joins requested in the query, which can be a bottleneck to total query run times. It is possible to limit the number of options the optimizer evaluates by tuning the optimizer_search_depth parameter. In addition, when limiting this value, the query plan can change significantly to evaluate the order in which the joins are performed. This means there are potential improvements in both the query optimization step as well as the actual query execution time in the overall operation.
Query Plan and Execution Time
Using the EXPLAIN function in MySQL it is possible to profile the query execution plan that is evaluated by the optimizer. The same queries that have been used in the tests of the previous sections were again executed as EXPLAIN SELECT ... but by using different values of the optimizer_search_depth parameter. The values used for the paramter are [0..10,20], where 0 instructs the optimizer to “auto-evaluate” the number of possibilities it should explore. These queries were then run on the 20-table join database across all columns on both the MyISAM and InnoDB engines. In addition, the queries were not cached by setting have_query_cache = NO and query_cache_size = 0 respectively.
The results of EXPLAIN on the queries indicate that the query optimization time is negligible in our table schema, of the order of a few milliseconds. The query plan deduced by the optimzer was found to be exactly the same irrespective of the value of optimizer_search_depth across all queries. Only one difference is observed, due to how the data is handled between engines. On the MyISAM engine, the query plan is a simple JOIN sequentially across the tables as T1.*, T2.*, ...T20.*, i.e., in the order in which the query itself specifies the joins. However, because InnoDB stores its data differently using table spaces and internal row optimizations (established during the INSERT phase), the number of rows that the query optimzer sees for each table differs slightly (from the actual 100,000 that are supposed to be in each). As a result, the query plan from EXPLAIN shows that the join order is dictated by how many rows each table has, in ascending order, i.e., starting with the table with the fewest rows to the largest number of rows.
Since the query optimization test shows the query plan to be static across all parametrizations, the run time for those queries also indicates that there are no performance improvements compared to results in the tables from previous sections. Performing a simple linear regression fit on the timings show further that there are no improvements to be had in either MyISAM or InnoDB using this method. Note the low run-time points in InnoDB are just fluctuations.
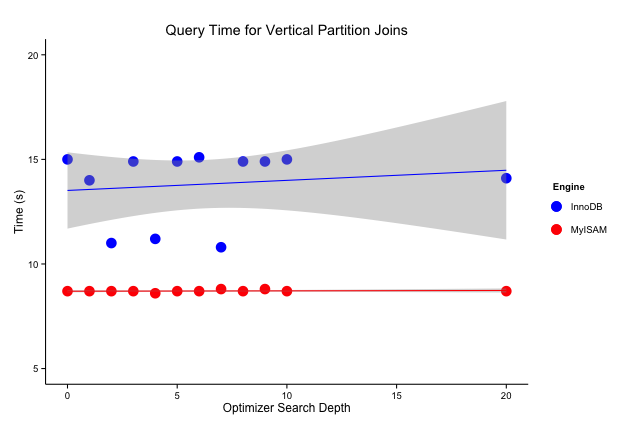
Figure 1 Total Query Execution Time for 20-table Join
Query Optimization Results
The query planning time is negligible, and the run time does not improve due to the lack of change in the query plan prescribed by the optimizer. This suggests that for the type of queries being run for simple joins, this plan is already the most optimal. MySQL does not need to evaluate any further options beyond the obvious joining order for such simple cases, i.e., without WHERE clauses or complex JOIN predicates, and hence no improvments are achieved by changing the values of certain parameters. Since the test queries are constructed as a representation of the proposed joins for Object and Source tables, this test can accurately translate the performance of vertical partition joins.
Test Code and Queries
The test code for this analysis can be found at the GitHub repo of this note. The query templates used are also available at the same location.